Why Visualization? Task Abstraction for Analysis and Design
- Matthew Brehmer | University of British Columbia
Why do people visualize data?
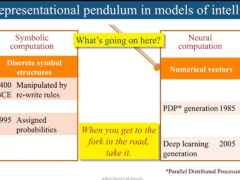
People visualize data either to consume or produce information relevant to a domain-specific problem or interest. Visualization design and evaluation involves a mapping between domain problems or interests and appropriate visual encoding and interaction techniques. This mapping translates a domain-specific situation into abstract visualization tasks, which allows for succinct descriptions of tasks and task sequences in terms of why data is visualized, what dependencies a task might have in terms of input and output, and howthe task is supported in terms of visual encoding and interaction idioms. Describing tasks in this way facilitates the comparison and cross-pollination of visualization idioms across application domains; the mapping also applies in reverse, whenever visualization researchers aim to contextualize novel visualization techniques.
In this dissertation, we present multiple instances of visualization task abstraction, each integrating our proposed typology of abstract visualization tasks. We apply this typology as an analysis tool in an interview study of individuals who visualize dimensionally reduced data in different application domains, in a post-deployment field study evaluation of a visual analysis tool in the domain of investigative journalism, and in a visualization design study in the domain of energy management.
In the interview study, we draw upon and demonstrate the descriptive power of our typology to classify five task sequences relating to visualizing dimensionally reduced data. This classification is intended to inform the design of new tools and techniques for visualizing this form of data.
In the field study, we draw upon and demonstrate the descriptive and evaluative power of our typology to evaluate Overview, a visualization tool for investigating large text document collections. After analyzing its adoption by investigative journalists, we characterize two abstract tasks relating to document mining and present seven lessons relating to the design of visualization tools for document data.
In the design study, we demonstrate the descriptive, evaluative, and generative power of our typology and identify matches and mismatches between visualization idioms and three abstract tasks relating to time series data.
Finally, we reflect upon the impact of our task typology.
-
-

Matthew Brehmer
Postdoctoral Researcher
-
-
Series: Microsoft Research Talks
-
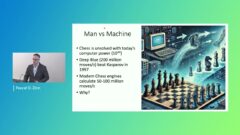
Decoding the Human Brain – A Neurosurgeon’s Experience
- Dr. Pascal O. Zinn
-
-
-
-
-
-
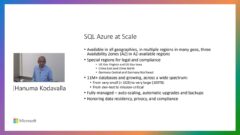
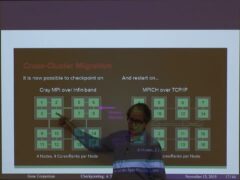
Challenges in Evolving a Successful Database Product (SQL Server) to a Cloud Service (SQL Azure)
- Hanuma Kodavalla,
- Phil Bernstein
-

Improving text prediction accuracy using neurophysiology
- Sophia Mehdizadeh
-

Tongue-Gesture Recognition in Head-Mounted Displays
- Tan Gemicioglu
-
DIABLo: a Deep Individual-Agnostic Binaural Localizer
- Shoken Kaneko
-
-
-
-
Audio-based Toxic Language Detection
- Midia Yousefi
-
-
From SqueezeNet to SqueezeBERT: Developing Efficient Deep Neural Networks
- Forrest Iandola,
- Sujeeth Bharadwaj
-
Hope Speech and Help Speech: Surfacing Positivity Amidst Hate
- Ashique Khudabukhsh
-
-
-

Towards Mainstream Brain-Computer Interfaces (BCIs)
- Brendan Allison
-
-
-
-

Learning Structured Models for Safe Robot Control
- Subramanian Ramamoorthy
-